In the dynamic world of data visualization, choosing the right tool is paramount for effective business intelligence. Power BI and Tableau stand out as two of the most prominent players, each offering unique features and capabilities. This article aims to provide a comprehensive comparison of Power BI vs Tableau, assisting businesses and individuals in making informed decisions.
Key Highlights
- Power BI boasts a familiar Microsoft-style interface, making it accessible for users already familiar with Microsoft tools
- Tableau, while intuitive, may have a steeper learning curve due to its unique interface design
- Both Power BI and Tableau offer extensive data connectivity options
- Power BI tends to be more cost-effective, especially for organizations already invested in the Microsoft ecosystem
Power BI Overview:
2.1 Features and Capabilities:
Power BI, developed by Microsoft, is a robust business analytics tool known for its user-friendly interface and seamless integration with other Microsoft products. Its features include interactive dashboards, drag-and-drop report building, and robust data modeling capabilities.
2.2 Strengths:
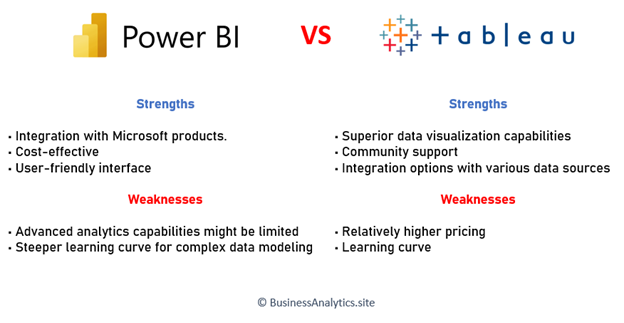
- Seamless integration with Microsoft products.
- Cost-effective solution, especially for organizations already using Microsoft tools.
- User-friendly interface, making it accessible to a wide range of users.
2.3 Weaknesses:
- Advanced analytics capabilities might be limited compared to Tableau.
- Steeper learning curve for complex data modeling.
Tableau Overview:
3.1 Features and Capabilities:
Tableau, a Salesforce company, is renowned for its powerful data visualization and exploration tools. It offers a highly intuitive interface, extensive data connectivity options, and advanced analytics features, making it a favorite among data professionals.
3.2 Strengths:
- Superior data visualization capabilities.
- Robust community support and a vast library of user-generated content.
- Comprehensive integration options with various data sources.
3.3 Weaknesses:
- Relatively higher pricing, especially for larger enterprises.
- Learning curve, especially for those new to data visualization tools.
Power BI vs Tableau: A Detailed Comparison:
4.1 User Interface:
Power BI boasts a familiar Microsoft-style interface, making it accessible for users already familiar with Microsoft tools. Tableau, while intuitive, may have a steeper learning curve due to its unique interface design.
4.2 Data Connectivity:
Both Power BI and Tableau offer extensive data connectivity options. Power BI excels in integrating seamlessly with Microsoft products, while Tableau’s versatility allows it to connect with a wide array of data sources.
4.3 Visualization Capabilities:
Tableau is often praised for its superior data visualization capabilities, offering a wider range of visualization options and customization features. Power BI, however, provides robust visualizations and is continually improving in this aspect.
4.4 Cost Comparison:
Power BI tends to be more cost-effective, especially for organizations already invested in the Microsoft ecosystem. Tableau may have a higher upfront cost, but its advanced features could justify the investment for enterprises with specific needs.
4.5 Integration with Other Tools:
Power BI seamlessly integrates with other Microsoft tools, offering a cohesive environment for users. Tableau, on the other hand, is known for its versatility in integrating with various data sources, providing flexibility for users with diverse toolsets.
4.6 Learning Curve:
Power BI generally has a lower learning curve, especially for users already familiar with Microsoft tools. Tableau’s more extensive feature set may require additional time for users to become proficient.
Choosing the Right Tool for Your Needs:
5.1 Business Requirements:
Consider the specific needs and goals of your business. Power BI may be preferable for organizations deeply integrated with Microsoft products, while Tableau’s advanced features may be more suitable for complex analytics needs.
5.2 Scalability:
Evaluate the scalability of your data visualization needs. Power BI is known for its scalability, particularly for smaller to medium-sized businesses. Tableau excels in handling larger datasets and complex analytics.
5.3 User-Friendliness:
Assess the technical proficiency of your team. Power BI’s familiarity with Microsoft interfaces may offer a smoother transition for Microsoft-centric organizations. Tableau’s more extensive features may appeal to users seeking a more robust tool.
5.4 Support and Community:
Consider the support and community resources available for each tool. Power BI benefits from Microsoft’s extensive support network, while Tableau boasts a vibrant community and a wealth of user-generated content.
Frequently Asked Questions
For small businesses, Power BI may be more cost-effective and user-friendly, whereas Tableau’s advanced features might be overkill.
Yes, organizations often use both tools based on specific needs. However, it’s essential to manage integration challenges effectively.
Yes, Power BI is generally considered more cost-effective, especially for Microsoft-centric organizations. Tableau’s pricing may be higher, but it offers advanced features.
Power BI seamlessly integrates with Microsoft products, providing a cohesive environment. Tableau, while versatile, may require additional effort for integration in certain scenarios.