In today’s data-driven business landscape, organizations rely on Business Intelligence reports to transform raw data into actionable insights. These reports provide decision-makers with valuable information to drive strategic decisions, optimize performance, and gain a competitive edge. This comprehensive guide explores the fundamentals of Business Intelligence reports, their importance, creation, types, benefits, and best practices.
Key Highlights
- The design and layout of Business Intelligence Reports should be intuitive, user-friendly, and visually appealing
- BI Platforms such as Tableau, Power BI, and QlikView offer comprehensive solutions for data visualization, analysis, and reporting
- Data Visualization Tools like D3.js, Plotly, and Google Data Studio provide powerful capabilities for creating visually appealing and interactive charts, graphs, and dashboards
- Reporting Software such as Crystal Reports, SSRS, and JasperReports facilitate the design and generation of Business Intelligence Reports from various data sources
Understanding Business Intelligence Reports
2.1 What are Business Intelligence Reports?
Business Intelligence Reports are documents or presentations that present data-driven insights, trends, and performance metrics to support decision-making and strategic planning within organizations.
2.2 Importance of Business Intelligence Reports
Business Intelligence Reports play a crucial role in providing stakeholders with timely, relevant, and accurate information to make informed decisions, monitor performance, and identify opportunities or threats.
2.3 Key Components of Business Intelligence Reports
Key components of Business Intelligence Reports include data visualization, analysis, interpretation, and actionable recommendations, tailored to meet the needs of different stakeholders.
Creating Effective Business Intelligence Reports
3.1 Data Gathering and Preparation
Effective Business Intelligence Reports start with the collection, cleansing, and preparation of data from various sources, ensuring its accuracy, completeness, and relevance for analysis.
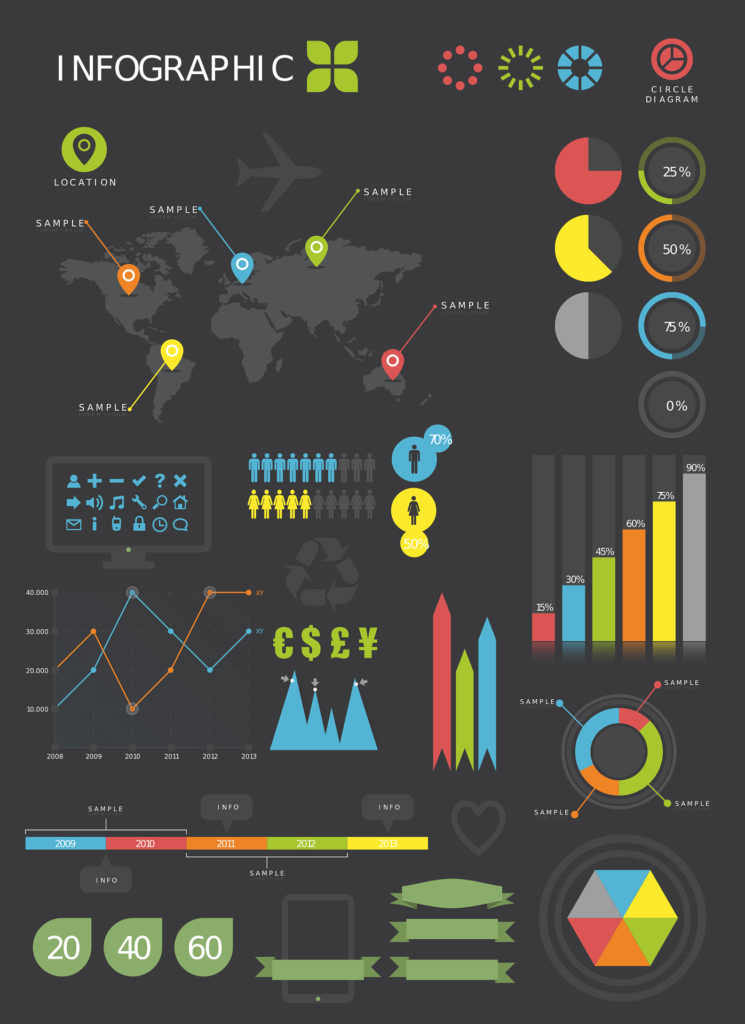
3.2 Data Analysis and Visualization
Data analysis techniques such as aggregations, calculations, and statistical methods are applied to derive insights from the data, which are then visualized using charts, graphs, and dashboards for easy interpretation.
3.3 Report Design and Layout
The design and layout of Business Intelligence Reports should be intuitive, user-friendly, and visually appealing, with clear labels, titles, and annotations to enhance understanding and usability.
Types of Business Intelligence Reports
4.1 Operational Reports
Operational Reports provide day-to-day insights into business processes, performance metrics, and operational efficiency, helping organizations monitor and improve their day-to-day operations.
4.2 Analytical Reports
Analytical Reports delve deeper into data analysis, exploring trends, patterns, and relationships to uncover insights and inform strategic decisions, such as market trends, customer behavior, and product performance.
4.3 Ad-Hoc Reports
Ad-Hoc Reports are customized reports generated on-demand to address specific queries or requirements, providing stakeholders with timely and relevant information to support ad-hoc decision-making.
Benefits of Business Intelligence Reports
5.1 Informed Decision-Making
Business Intelligence Reports empower decision-makers with actionable insights and recommendations, enabling them to make informed decisions based on data-driven evidence rather than intuition or guesswork.
5.2 Performance Monitoring and Optimization
By tracking key performance indicators (KPIs) and metrics, Business Intelligence Reports help organizations monitor performance, identify areas for improvement, and optimize processes to achieve strategic objectives.
5.3 Competitive Advantage
Business Intelligence Reports provide organizations with a competitive advantage by enabling them to anticipate market trends, understand customer preferences, and identify opportunities for innovation and growth ahead of competitors.
Tools and Technologies for Generating Business Intelligence Reports
6.1 BI Platforms
BI Platforms such as Tableau, Power BI, and QlikView offer comprehensive solutions for data visualization, analysis, and reporting, allowing organizations to create interactive and insightful Business Intelligence Reports.
6.2 Data Visualization Tools
Data Visualization Tools like D3.js, Plotly, and Google Data Studio provide powerful capabilities for creating visually appealing and interactive charts, graphs, and dashboards to communicate insights effectively.
6.3 Reporting Software
Reporting Software such as Crystal Reports, SSRS (SQL Server Reporting Services), and JasperReports facilitate the design and generation of Business Intelligence Reports from various data sources, offering customization and automation features.
Best Practices for Creating and Using Business Intelligence Reports
7.1 Understand User Requirements
Before creating Business Intelligence Reports, it’s essential to understand the needs and requirements of end-users, including their goals, preferences, and level of expertise, to ensure the reports are relevant and actionable.
7.2 Ensure Data Accuracy and Consistency
Maintaining data accuracy and consistency is critical for reliable Business Intelligence Reports. This involves implementing data governance policies, validating data sources, and ensuring data quality throughout the reporting process.
7.3 Provide Context and Interpretation
In addition to presenting data, Business Intelligence Reports should provide context, interpretation, and actionable recommendations to help stakeholders understand the implications of the findings and make informed decisions.
Frequently Asked Questions
The key components of Business Intelligence Reports include data visualization, analysis, interpretation, and actionable recommendations, tailored to meet the needs of different stakeholders.
Business Intelligence Reports empower organizations with timely, relevant, and accurate information to make informed decisions, monitor performance, and gain a competitive advantage in the market.
Common tools and technologies used for generating Business Intelligence Reports include BI platforms like Tableau and Power BI, data visualization tools like D3.js and Plotly, and reporting software like Crystal Reports and SSRS.
Best practices for creating and using Business Intelligence Reports include understanding user requirements, ensuring data accuracy and consistency, providing context and interpretation, and incorporating actionable recommendations for decision-making.